


I led the design team that designed the first AI tools for WordPress. I studied Product Design for AI taught by IBM's former Principal AI Designer, Robert Redmond, to enhance collaboration with AI engineers.
With the explosion of AI, I led the design team that integrated the first AI tools into WordPress.
As a life-long learner, I completed the Product Design for AI course taught by IBM's former Principal AI Designer, Robert Redmond, to lead my team better and enhance collaboration with AI engineers.
With the explosion of AI, I led the design team that integrated the first AI tools into WordPress. As a life-long learner, I completed the Product Design for AI course taught by IBM's former Principal AI Designer, Robert Redmond, to lead my team better and enhance collaboration with AI engineers.
Course project:
Insight Bridge
The Problem
Product teams struggle to quickly prioritize UX issues, often missing improvement opportunities while sifting through diverse data sources.
Objectives
Create an AI driven app to help users quickly identify potential opportunities for improvement in their applications.
Create real-world, implementable AI Technical map architecture.
Create wireframes and ux flows for core features.
Create a pitch deck to present to stakeholders to show the value prop of building the app.
Audience
UX & Growth Designers.
Product Managers & Product Owners
Growth Engineers & Engineers.
Researchers
01
Insight Bridge
AI Products for WordPress
Inside the WordPress Editor
Problem
Product teams struggle to quickly prioritize UX issues, often missing improvement opportunities while sifting through diverse data sources.
Objectives
Designed an AI-driven app to quickly identify product improvement opportunities
Turned omnichannel user feedback into an actionable product roadmap
Created a real-world AI technical architecture map
Developed wireframes and UX flows for core features
Audience
UX & Growth Designers.
Product Managers & Product Owners
Growth Engineers & Engineers.
Researchers
BEFORE
Manual Workflow
Insights from support tickets, analytics, and customer feedback live in silos, making it hard to see the full picture.
Support team flags an uptick in tickets about onboarding.
- They send a Slack message or file a vague Jira ticket.Product team looks at the issue in isolation, pulls analytics and omni-channel data separately.
- No clear link to churn or revenue impact.UX team starts investigating but lacks context on where in the flow users drop. Duplicate work + guessing.
Engineering gets a bug request with little detail.
- Reproducing and scoping takes weeks.Teams go back and forth to align priorities.
- Decisions stall; easy to deprioritize.Roadmap decisions are difficult to defend to leadership without data-backed insights.
Result: Slow, fragmented, lots of handoffs without clarity.
Sweating the details
AI Technical mapping
AI Workflow
InsightBridge detects onboarding drop-offs correlated with error message tickets.
- Surfaces an insight card: “20% churn in first month tied to unclear error messaging.”The card shows confidence level and supporting data (ticket volume, analytics pattern).
AI routes the insight to the right function:
UX: phrasing fix needed.
Product: flagged as roadmap priority due to churn impact.
Engineering: API error pattern evidence attached.
Teams can Accept / Refine / Dismiss the insight inline.
- Faster validation, less duplication.History is logged: last quarter was dismissed etc.
- Continuous learning and accountability.
Result: Weeks of cross-functional back-and-forth condensed into a few clicks, with clear ownership and measurable impact.
AI Technical mapping
NLP
Extract themes, detect sentiment, and categorize feedback with refinement options.
Sentiment Analysis
Gauge user sentiment to calculate frustration scores.
Topic Modeling
Identify recurring feedback themes and pain points.
Predictive Analytics
Forecast trends like churn and prioritize UX risks.
Machine Learning
Automate behavior analysis with manual refinement.
Recommendation Systems
Deliver personalized roadmap suggestions.
Anomaly Detection
Spot deviations to flag potential issues.
Clustering & Segmentation
Group users/feedback for targeted improvements.
Jobs to be done
UX & Growth Designers
Identify opportunities to improve CVR and overall features.
Identify critical issues with existing features.
Product Managers & Owners
Prioritize roadmap items.
Address revenue-critical issues.
Engineers & Growth Engineers
Assess the frustration level and audience impact of issues requiring significant development investment.
Researchers
Tailor research scripts to explore issues identified in the app.
Pinpoint key areas for further research.
Jobs to be done
UX & Growth Designers
Identify opportunities for improving CVR and features over all.
Identify critical issues with existing features.
Product Managers & Owners
Prioritize roadmap items.
Address revenue-critical issues.
Engineers & Growth Engineers
Assess the frustration level and audience impact of issues requiring significant development investment.
Researchers
Tailor research scripts to explore issues identified in the app.
Pinpoint key areas for further research.
AI Technical mapping
NLP: Extract themes, detect sentiment, and categorize feedback with refinement options.
Sentiment Analysis: Gauge user sentiment to calculate frustration scores.
Topic Modeling: Identify recurring feedback themes and pain points.
Predictive Analytics: Forecast trends like churn and prioritize UX risks.
Machine Learning: Automate behavior analysis with manual refinement.
Recommendation Systems: Deliver personalized UX suggestions.
Anomaly Detection: Spot deviations to flag potential issues.
Clustering & Segmentation: Group users/feedback for targeted improvements.
Technical flow map
Define data flow and decision points, integrating AI workflow automation with manual user intervention to manage, prioritize, and address customer feedback or issues.

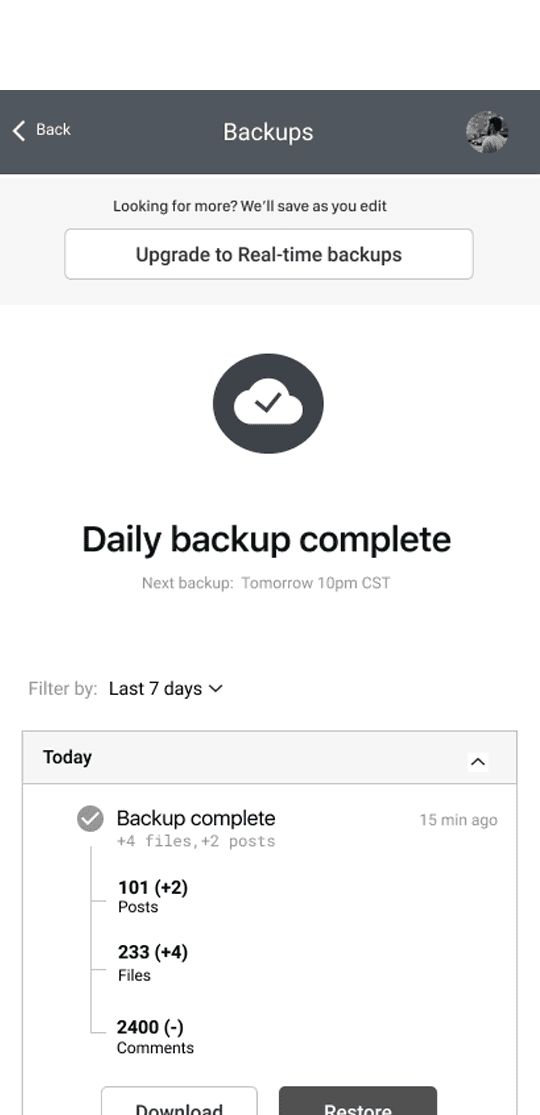
AI dashboard wireframe with user feedback flow
This wireframe outlines a seamless flow that integrates AI insights with manual intervention, providing a user-friendly interface for efficient decision-making and improved user experience.

Design Musts
Cross-Functional Language Bridging
UX, Product, and Engineering interpret “insights” differently.
Example: Same insight rendered in different “views”:
UX view: “Users confused by error copy after step 2.”
Product view: “20% churn in onboarding due to unclear error handling.”
Engineering view: “Error triggered after Y API call in 18% of flows.”
Log in detects role and a "View As” toggle at the top of each insight: UX / Product / Engineering. The insight reframes itself accordingly.
Design for Trust, Automation, Productivity
AI surfaced insights but also explained the “why” behind them, not just what to act on.
Designers and Engineers need to know why users struggle, not just that they do, in order to focus on the true UX problems.
PMs have to prioritize roadmaps. If AI says “fix onboarding,” they need to know why it’s critical (e.g., “onboarding issues drive 20% of churn in month one”).
Seamless AI ➡︎ Human handoffs
AI generates something → Human sees it clearly marked as AI.
Human can review, edit, or override without friction.
The system preserves the reasoning + context so the human doesn’t feel they’re starting from zero.
The audit trail is clear (who/what did what, and why).
Human-in-the-Loop Validation
AI should propose; humans decide. Adoption increases when people
feel in control.
Example: Each insight has Accept / Refine / Dismiss options. If dismissed, capture the reason (e.g., “edge case, low impact”). This trains the model and builds trust.
Bias & Coverage Safeguards
AI may over-prioritize frequent issues and miss critical edge cases.
InsightBridge could flag underrepresented segments (“low volume but high impact failures in enterprise accounts”) to balance the bias toward high-frequency data.
Add a coverage alert panel at the bottom of insights, flagging underrepresented but high-impact patterns (e.g., “Only 5% of users, but 80% churn in Enterprise accounts”).
Cross-Functional Language Bridging
UX, Product, and Engineering interpret "insights" differently.
Example: Same insight rendered in different "views":
UX view: "Users are confused by error copy after step 2."
Product view: "20% churn in onboarding due to unclear error handling."
Engineering view: "Error triggered after Y API call in 18% of flows."
Design for Trust, Automation, Productivity
AI surfaced insights but also explained the "why" behind them, not just what to act on.
Teams need to understand why users struggle, not just that they do.
PMs have to prioritize roadmaps. If AI says "fix onboarding," they need to know why it's critical.
Seamless AI ➡︎ Human handoffs
AI generates something → Human sees it clearly marked as AI.
Humans can review, edit, or override without friction.
The system preserves the reasoning + context so the human doesn't feel they're starting from zero.
The audit trail is clear (who/what did what, and why).
Human-in-the-Loop Validation
AI should propose; humans decide. Adoption increases when people feel in control.
Bias & Coverage Safeguards
AI may over-prioritize frequent issues and miss critical edge cases.
InsightBridge could flag underrepresented segments ("low-volume but high-impact failures in enterprise accounts") to balance the bias toward high-frequency data.
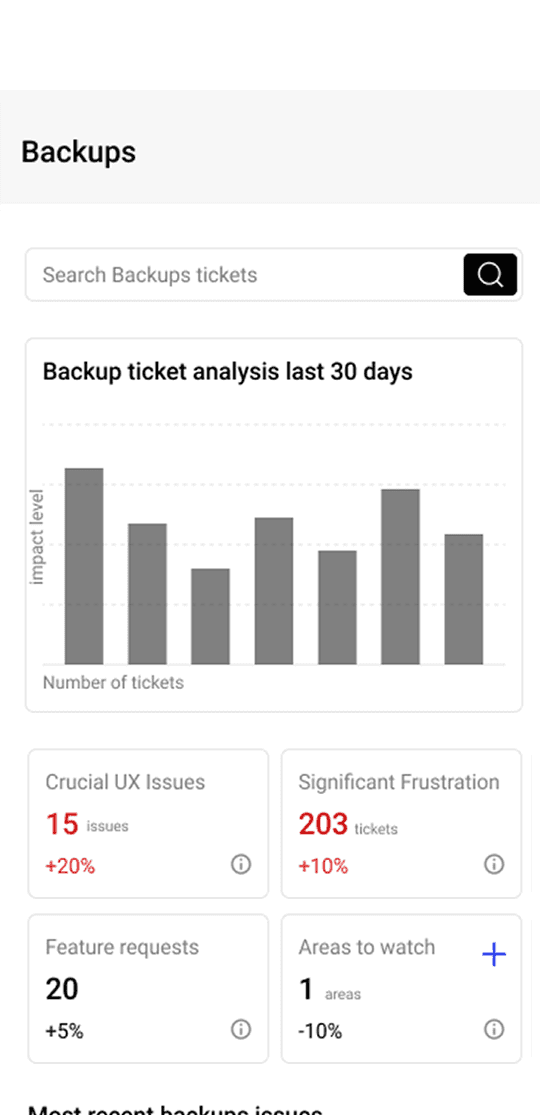
Detailed wireframes
This app would need human intervention to help shape the data. I mapped out each step where designers, product owners an engineers could shape the data.
Feature ideation

Close the loop: Notify users who abandoned a task due to an issue once it's fixed to rebuild trust.
Close the loop: Notify users who abandoned a task due to an issue once it's fixed to rebuild trust.


Learnings
Need more touchpoints for users to "teach" the LLM.
Understanding the cost limitations, engineering requirements, and computing power required for teaching and ongoing learning with AI models.
Insight into biases in data used in AI-driven products and how to ensure AI projects are inclusive.
The pitch deck
To complete the course, I created a pitch deck for stakeholders, highlighting the benefits of implementing Insight Bridge, along with a SWOT analysis to support the proposal.