

UX Cartographer
COMPANY
Independent AI concept
ROLE
Product architecture · UX intelligence
YEAR
2026
Map
BEFORE REDESIGN
3
EVIDENCE LABELS
1
LIVING ATLAS
THE 60-SECOND VERSION
CHALLENGE
AI can generate entire products in minutes. Teams are left without a shared map of what was built, how it connects, or where users fail.
APPROACH
Map structure, routes, screens, navigation, flows, states, and UX health. Label every significant finding Observed, Inferred, or Unknown.
OUTCOME
A living product atlas so designers, PMs, and engineers share one architectural story before anyone redesigns.
UNDERSTANDING SHOULD EVOLVE ALONGSIDE THE PRODUCT.
WHAT I SHIPPED
01
Product map
Areas, surfaces, relationships, and complexity — not a screen dump.
02
Flows and states
Golden paths, failure, recovery, and the states that are missing.
03
UX health
Diagnosis and a fix queue after the map, never before.
04
Evidence labels
Observed, Inferred, and Unknown stay visible so guesses never read as facts.
LEARNINGS
Map before improving.
Evidence before opinion.
No fake certainty.
Protect what already works.
Welcome to the bottom of the page. You 🤘
Want to get into more details? Continue on desktop for full case studies that cover the research, the tradeoffs, more artifacts in detail.


hello@ydoll.com

PROJECT TYPE
Team productivity AI
WHAT I OWNED
Product architecture · UX intelligence
I built UX Cartographer to solve a collaboration problem: give Design, Product, and Engineering the same view of what AI generated, so they can align on what’s broken before anyone starts adding to or editing the feature.
Software is now easier to create than it is to understand. Cartographer is the missing layer: a living map of the product, updated as the product itself changes.
01
UX Cartographer
Living product atlas
Problem
AI can generate entire products in minutes. Teams are collaborating so quickly but are left without a shared map of what was built, how it connects, what's drifted from the PRD or where users fail.
Objectives
Map the product so teams can understand it before anyone redesigns
Label findings Observed, Inferred, or Unknown
Produce living reports that evolve with the product
Give design, product, and engineering one shared atlas
Audience
Product designers.
Product managers and owners
Engineers.
Researchers
01
UX Cartographer
Living product atlas
Problem
AI can generate entire products in minutes. Teams are collaborating so quickly but are left without a shared map of what was built, how it connects, what's drifted from the PRD or where users fail.
Objectives
Map the product so teams can understand it before anyone redesigns
Label findings Observed, Inferred, or Unknown
Produce living reports that evolve with the product
Give design, product, and engineering one shared atlas
Audience
Product designers.
Product managers and owners
Engineers.
Researchers
BEFORE
Static documentation
Site maps, flows, and IA docs go stale as soon as the product changes. Generation makes that gap worse.
A designer opens last days' flow diagram.
- It no longer matches the shipped routes.Engineering added screens the map never captured.
- Nobody can name the golden path with confidence.Reviews argue from screenshots, not from a shared product model.
Empty, error, and permission states stay invisible until users hit them.
- Complexity accumulates with no record of what changed.Recommendations start before anyone agrees what exists.
- Easy to ship more UI. Harder to understand the product.Leadership sees output, not architecture.
Result: Documentation that cannot keep up with generation.
How the atlas is built

The atlas
Living map
Cartographer reads the product as it exists: routes, screens, navigation, and how they connect.
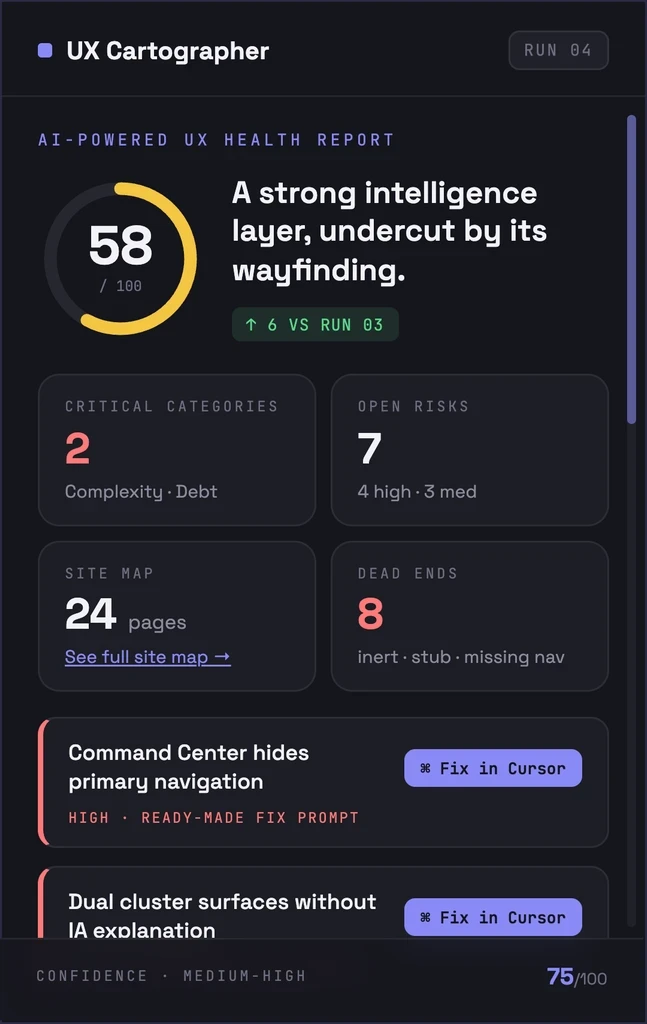
- It writes a product map, screen inventory, flow map, and state coverage.“Hero diagnosis: what the experience actually is, in one sentence.”The card shows evidence labels and screens, routes, and flows (Observed, Inferred, or Unknown).
Reports answer different jobs without changing the facts:
Designers: where the experience is incoherent.
PMs: which journeys are incomplete or high-risk.
Engineering: which states and routes are missing.
Teams see Map / Evidence / Unknown before anyone edits.
- Proposed changes are shown before implementation.Product evolution tracks what changed since the last map.
- Understanding stays current as the product moves.
Result: A living atlas instead of a stale deck, with visible confidence and a fix queue.

The atlas
Product map
Product areas, surfaces, relationships, and complexity.
Screen inventory
Screens, routes, purposes, status, and evidence.
Navigation intelligence
Wayfinding, dead ends, orphans, and mental-model fit.
Flow map
Goals, paths, entry points, success, failure, and recovery.
State coverage
Loading, empty, error, success, disabled, and permission states.
UX health report
Diagnosis, score, findings, risks, and what to fix first.
Fix queue
Actionable fixes with acceptance criteria, after the diagnosis.
Product evolution
What changed, where complexity grew, and what drifted.

Jobs to be done
Product designers
Understand what the product actually does and how it is organized.
See where users are likely to fail before a redesign starts.
Product managers and owners
Prioritize from incomplete flows and UX health, not the loudest screenshot.
Name structural risk and missing states before proposing a rebuild.
Engineers
See which flows are incomplete and which states are missing from the shipped product.
Researchers
Ground research in observed journeys, not assumed ones.
See what is Unknown so research time is not spent re-proving the obvious.
How a run works
Map the product, inventory screens, audit navigation, generate flows, audit states, score UX health, then write a fix queue. Diff only when a prior map exists. Creates Cursor prompts for every suggested fix. Browser view for more visual users, Cursor agent chat view for backend workflows.

Actionable reports
Output should feel like a strategic product development report with actionable insights for next steps. I wrote the underlying MDC skills and evaluation criteria that drive this, but I'm showing the reporting here because that's the part the team actually uses to collaborate and make decisions.”



Design Musts
One product voice
Design, product, and engineering need the same map, even when they ask different questions.
Example: Same atlas, different jobs:
Design view: “Where is the experience incoherent?”
Product view: “Which journeys are incomplete or high-risk?”
Engineering view: “Which states and routes are missing?”
Every finding carries a “confidence” marker marks Observed vs Inferred vs Unknown so nobody treats a guess as a fact.
Evidence before opinion
Cartographer names what exists, then names impact, then recommends. Never the reverse.
Designers and Engineers need to see the evidence behind a finding, not just a severity label.
If a report says “fix onboarding,” the reader needs to know why it is first (e.g., “the golden path has no recovery from this error state”).
Human judgment stays in charge
The map is generated. The decisions stay human.
Human can preview, challenge, or reject without friction.
The system preserves the Observed / Inferred / Unknown so a recommendation can be trusted or thrown out.
The evidence trail is clear (who/what did what, and why).
Map before improving
Cartographer explains what exists before it recommends a change. People
keep judgment.
Example: Each finding is Map / Evidence / Unknown. Proposed file and behavior changes are shown in chat before anyone implements.
No fake certainty
If evidence is weak, the report says so. Inferred and Unknown are never presented as fact.
Missing screenshots, analytics, or research are called out as Unknown instead of filled in.
Keep an Unknown column in the evidence table, so gaps stay visible instead of being smoothed over.